
AI-powered Analysis with Tableau Next
This post highlights my experience using Salesforce's new offering "Tableau Next" through the Tableau Next Hackathon.

What is Tableau Next?
Tableau Next is Salesforce’s next-generation analytics platform. Unlike traditional BI tools that focus mostly on dashboards, Tableau Next integrates a “semantic layer”, AI-driven agents, and real-time triggers to move beyond reporting. It doesn’t just answer questions, but also helps businesses take immediate action by adding ‘intelligence’ directly into workflows like Slack or Salesforce
Tableau Next’s Architecture
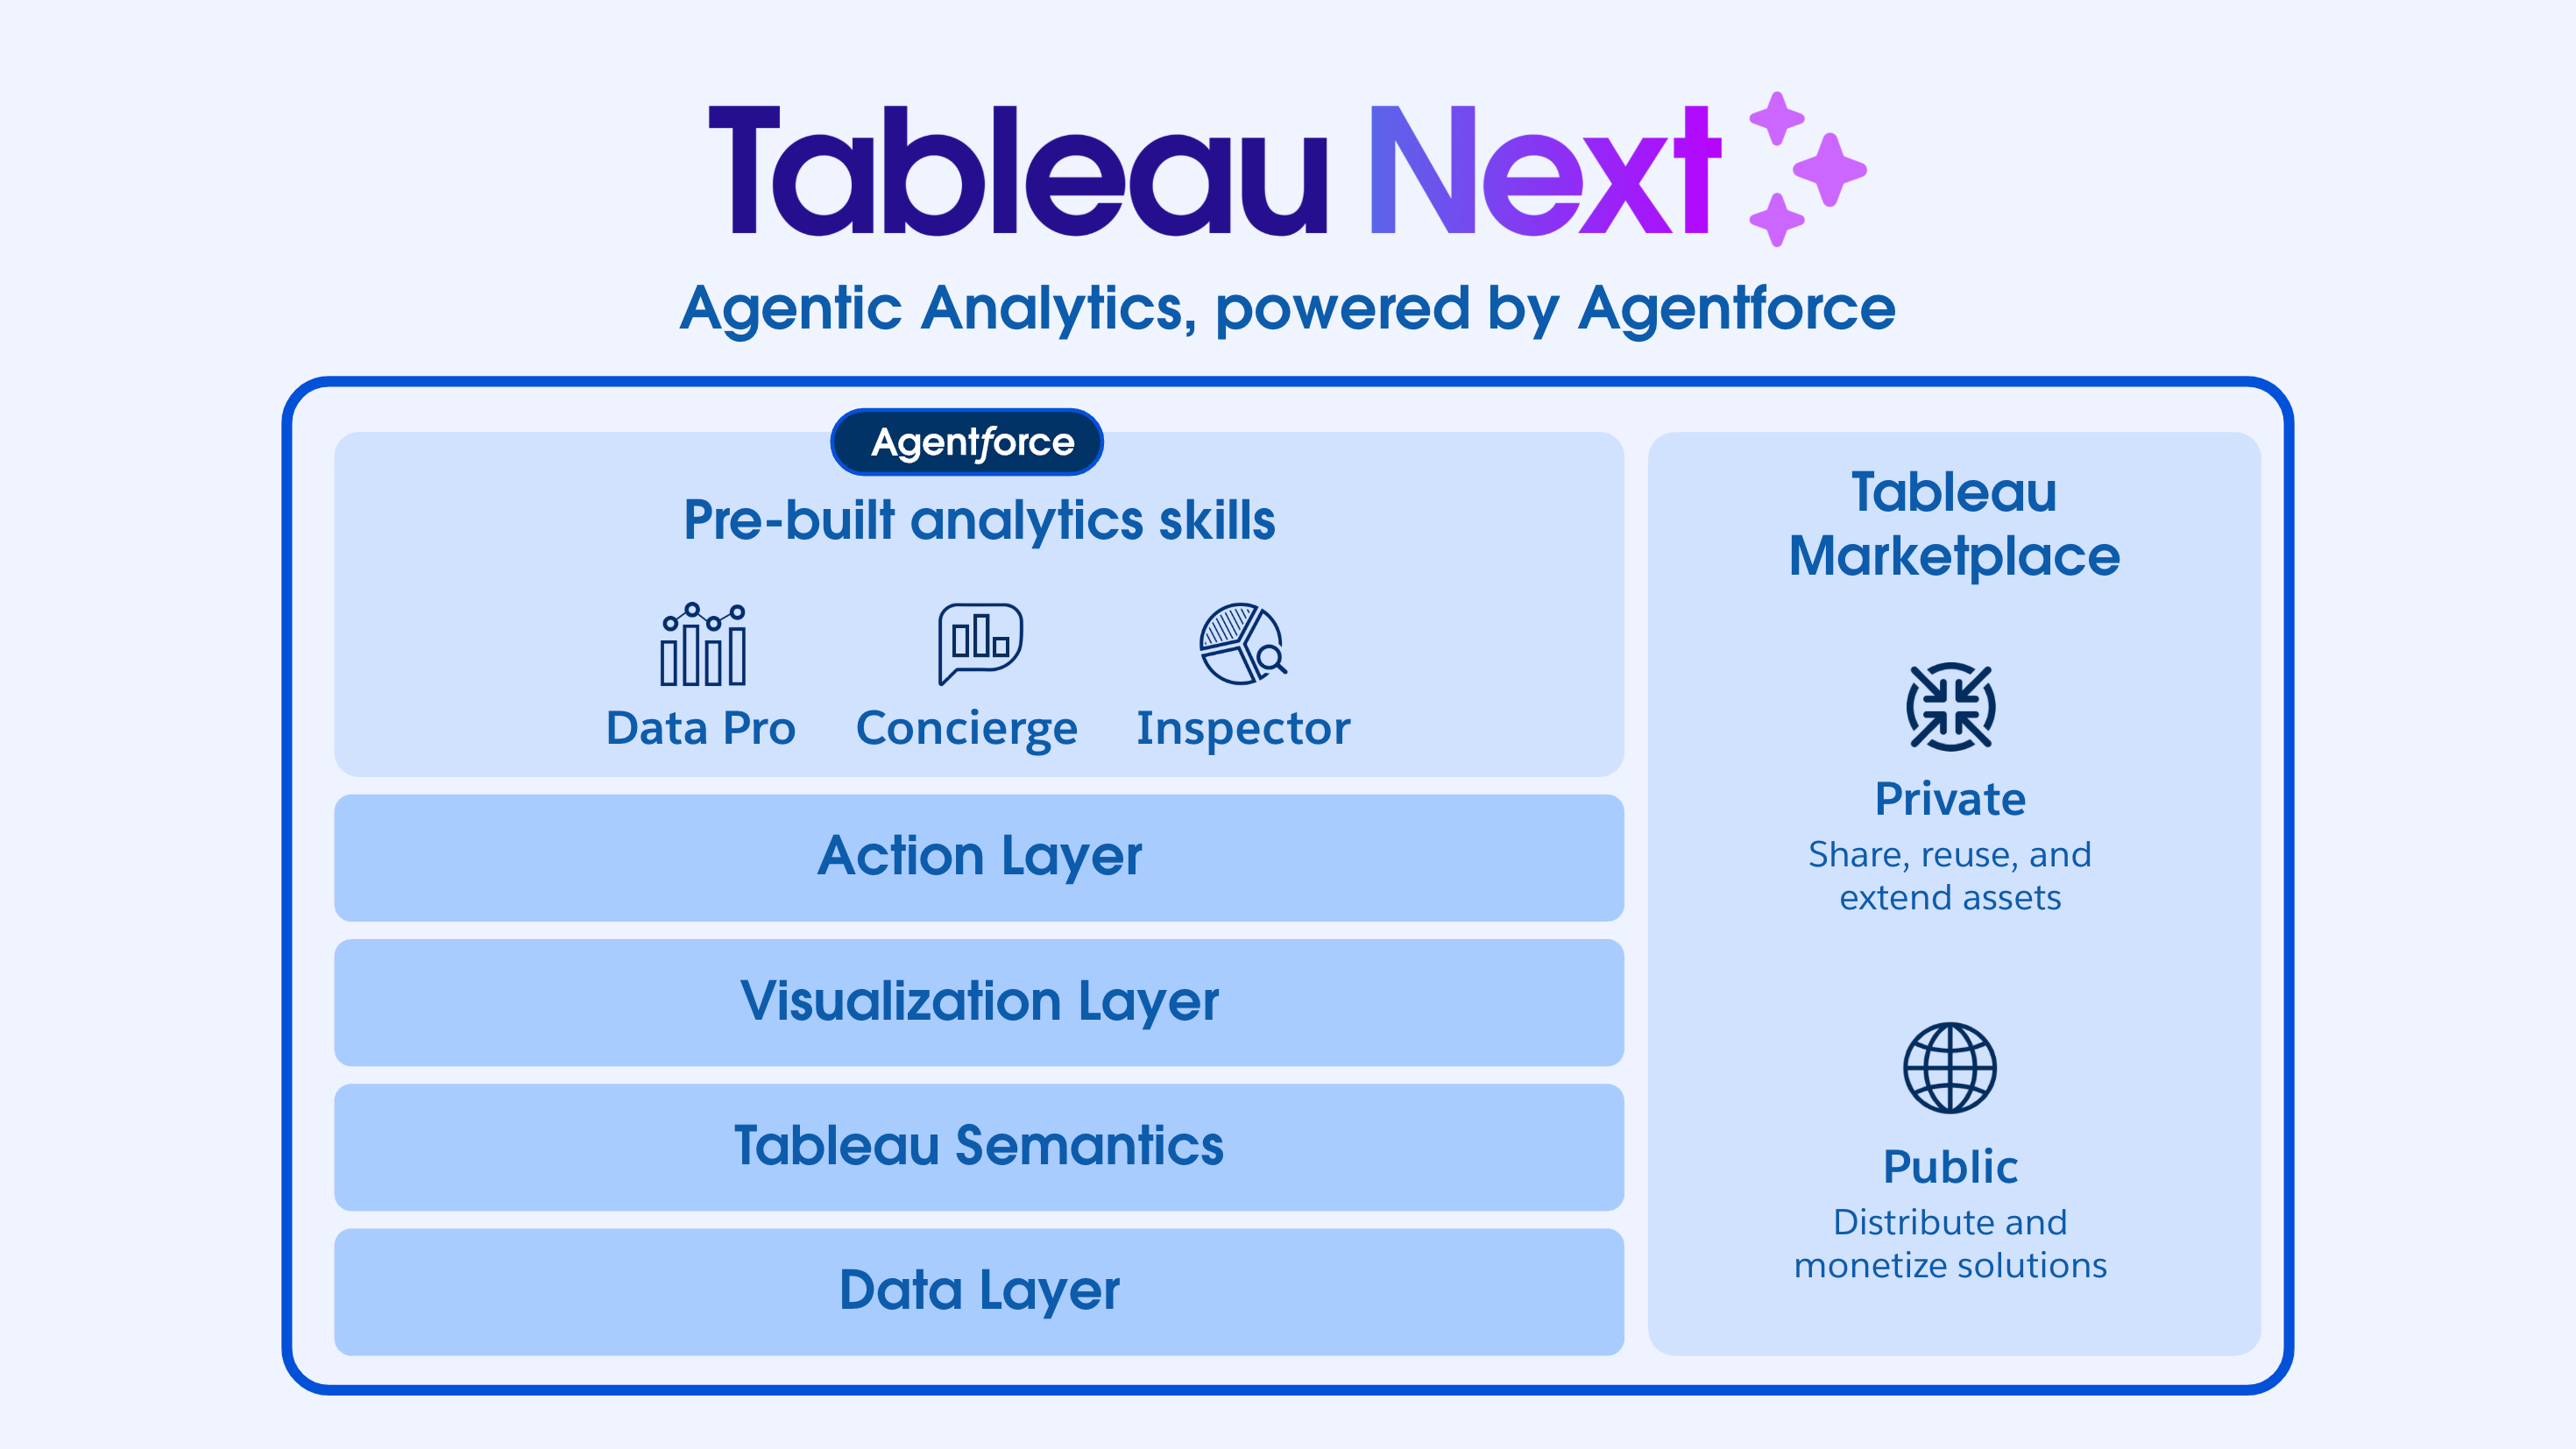
Tableau Next is built on four core layers:
Data Layer: Connects to Salesforce objects, external systems, and files.
Semantic Layer: Defines governed metrics and KPIs so everyone works with a single source of truth.
Visualization Layer: Allows interactive dashboards and visual analysis, though simplified compared to classic Tableau.
Actions Layer: Enables alerts, Slack notifications, and workflow triggers when metrics cross thresholds.
This layered design ensures consistency from raw data all the way to actions that impact the business in real time.
Okay, now diving into my hackathon experience -
The Problem
Our hackathon challenge was centered on the Quote-to-Cash (QTC) process - the backbone of revenue operations.
For the uninitiated, Quote-to-Cash (QTC or Q2C) is the end-to-end business process that covers everything from generating a customer quote, to closing the opportunity, fulfilling the order, issuing invoices, and finally collecting payment. It ties together Sales, Finance, and Operations, making it one of the most critical processes for ensuring accurate revenue recognition and healthy cash flow.
We wanted to answer:
How can we track each stage of QTC (Quote → Opportunity → Order → Invoice → Cash) with clear SLA definitions?
How do we ensure real-time alerts when metrics go out of range, so businesses don’t just analyze problems after the fact, but act on them immediately?
Approach
Working as a team with my teammates Rahul Padwani and Sourabh Rodagi, we broke down the problem step by step.
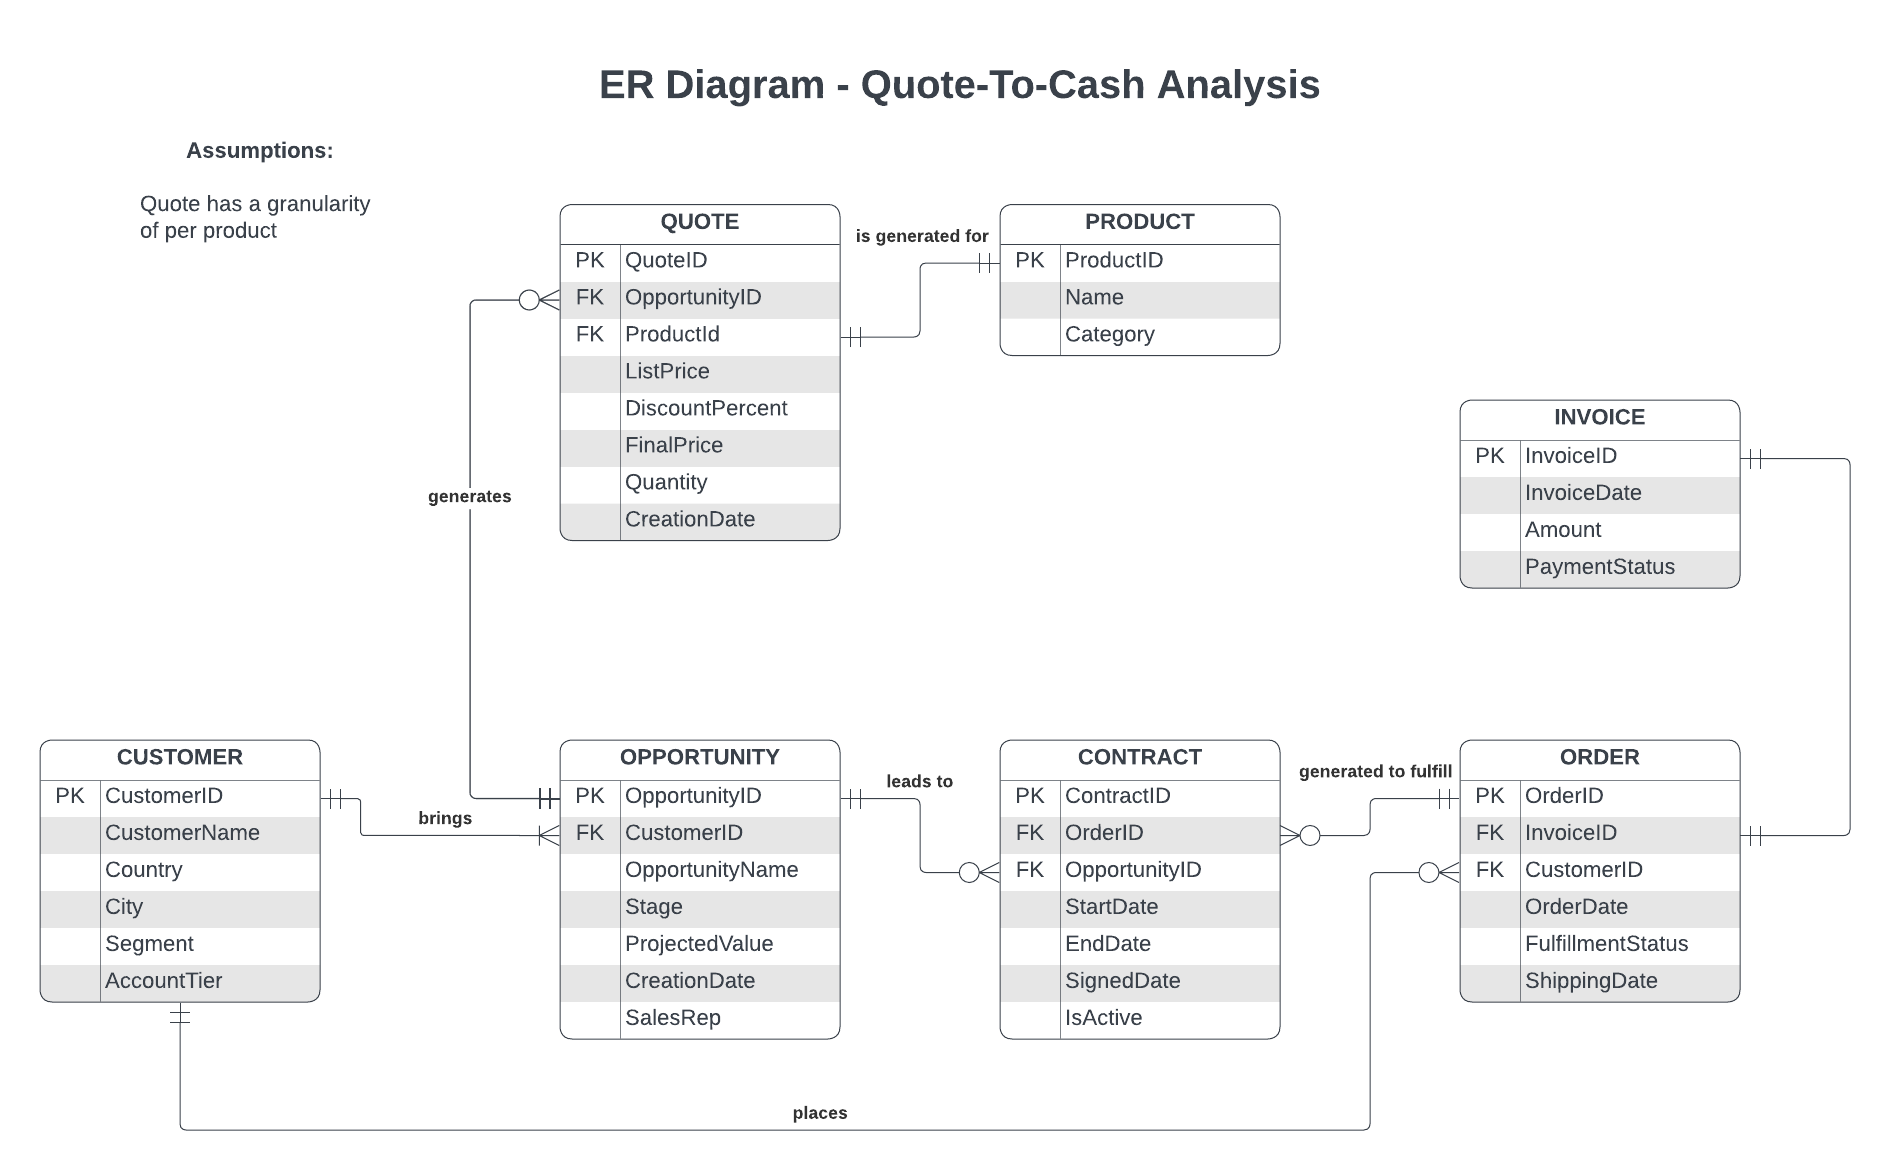
ER Diagram: We first designed an entity-relationship diagram of Customers, Opportunities, Quotes, Orders, Contracts, and Invoices to map the full QTC lifecycle.
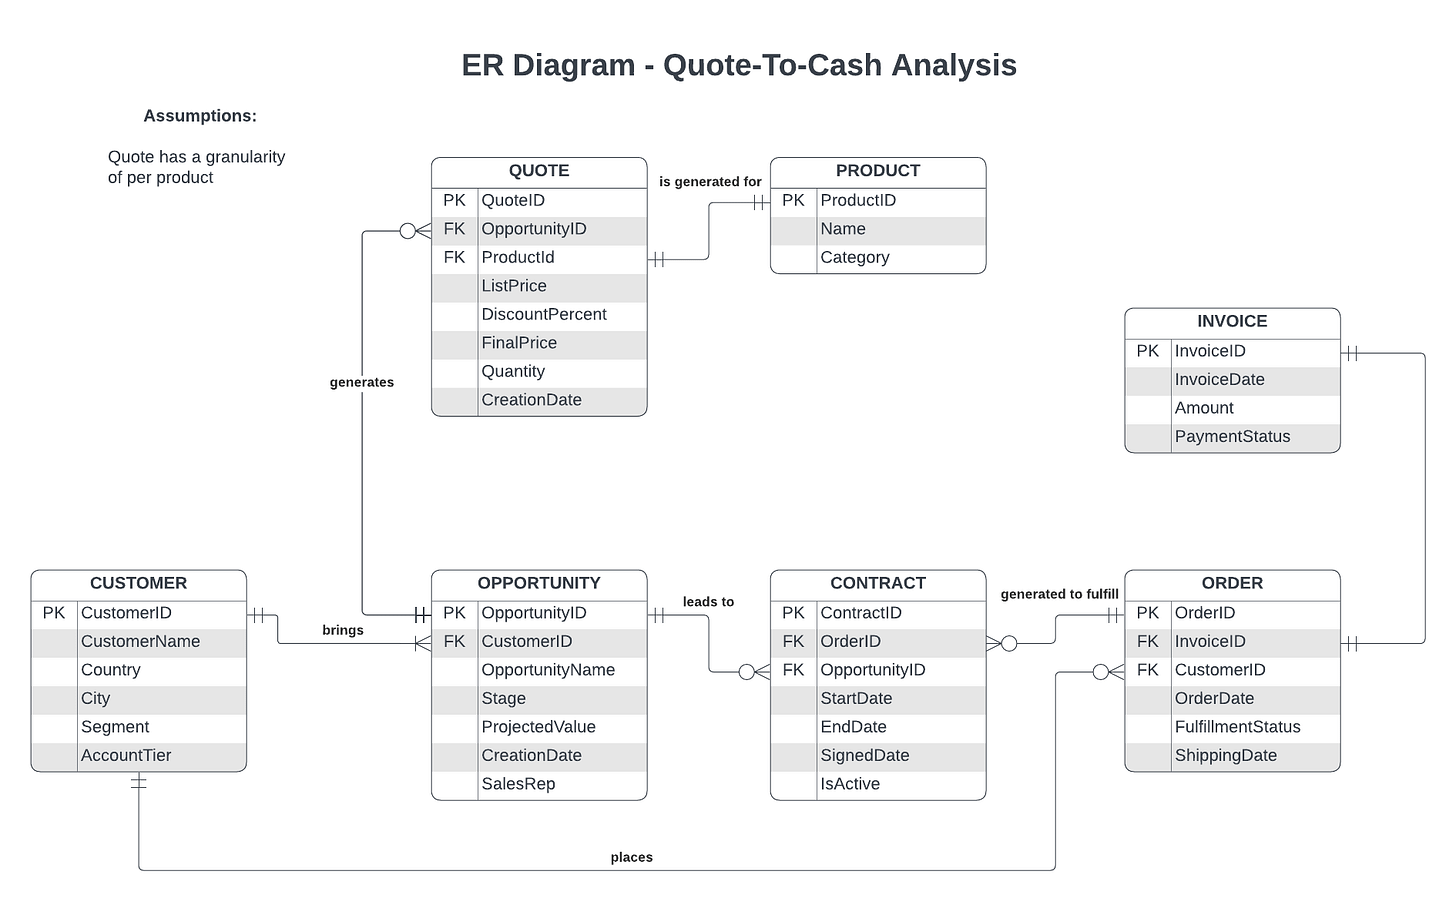
ER Diagram - Q2C Analysis Sample Dataset: Using Claude, we generated synthetic but fairly realistic Salesforce-style data to simulate a working pipeline.
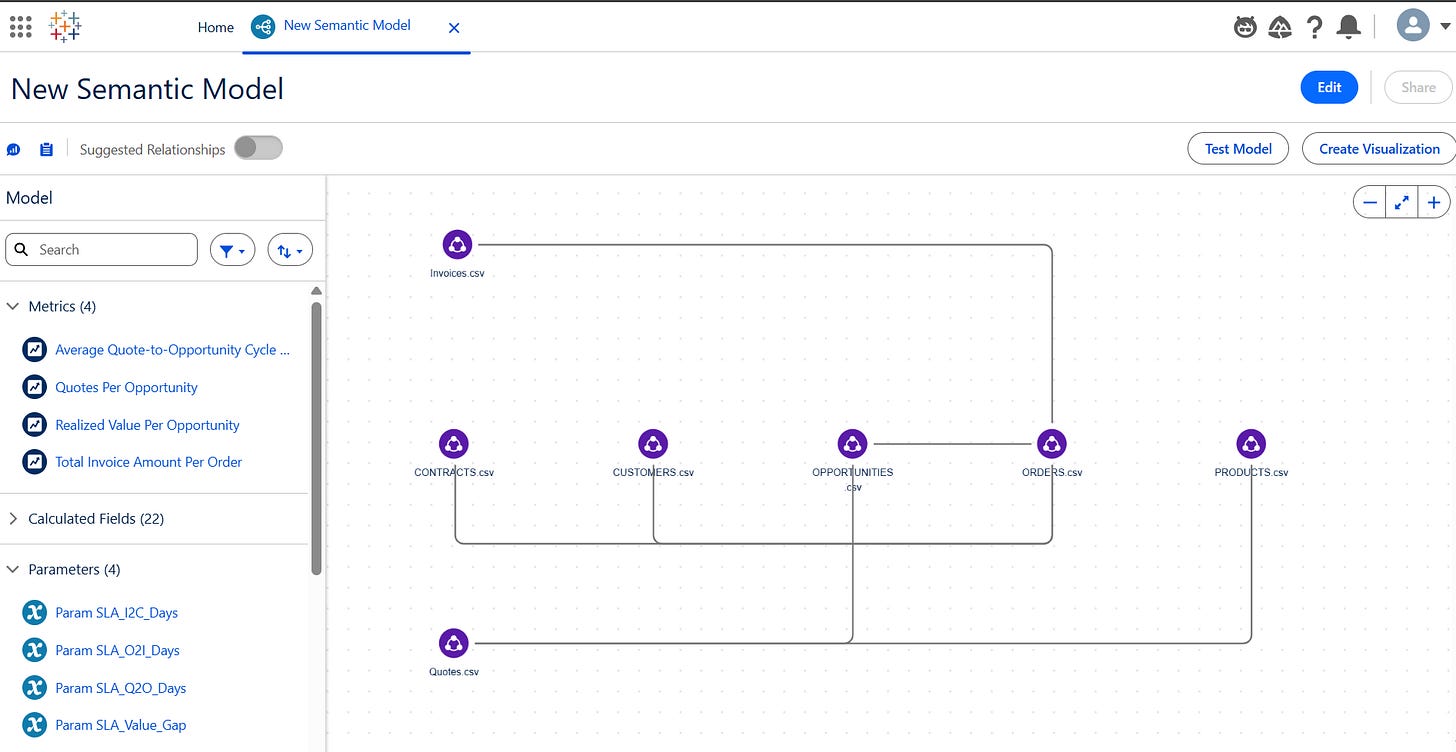
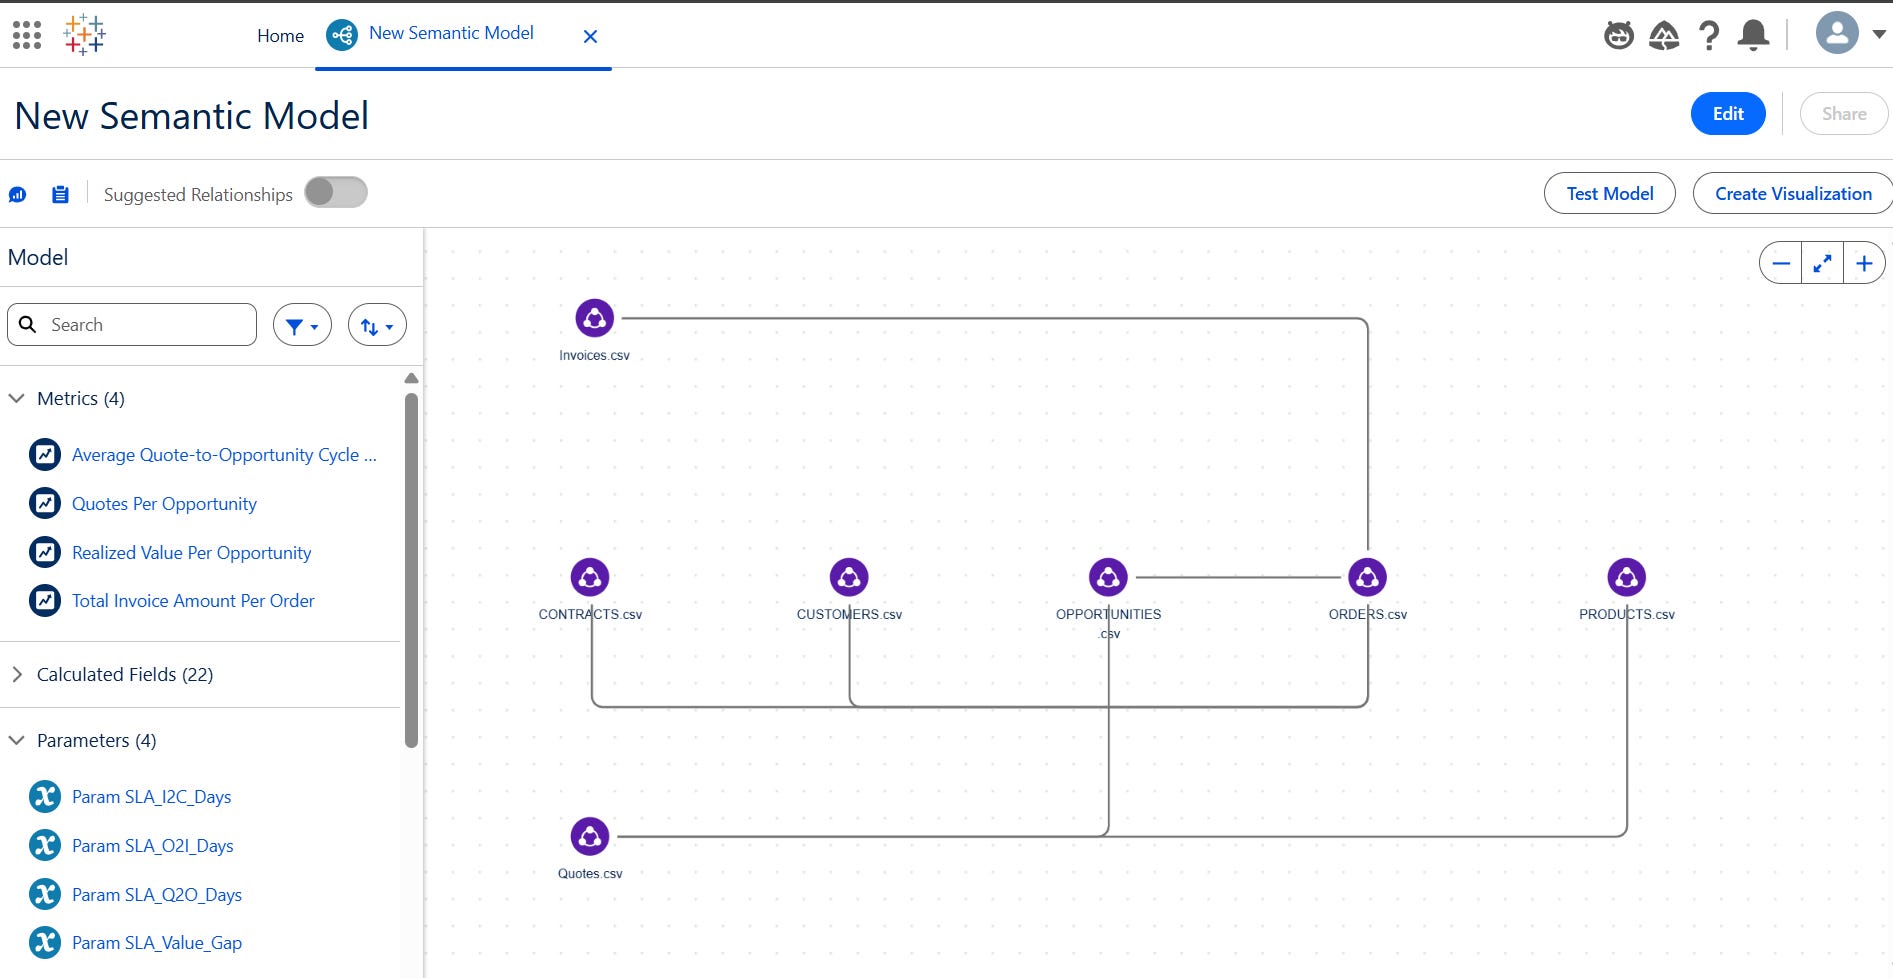
Semantic Model: We defined calculated fields for cycle times, conversion rates, projected vs. realized values, and overdue invoice percentages.
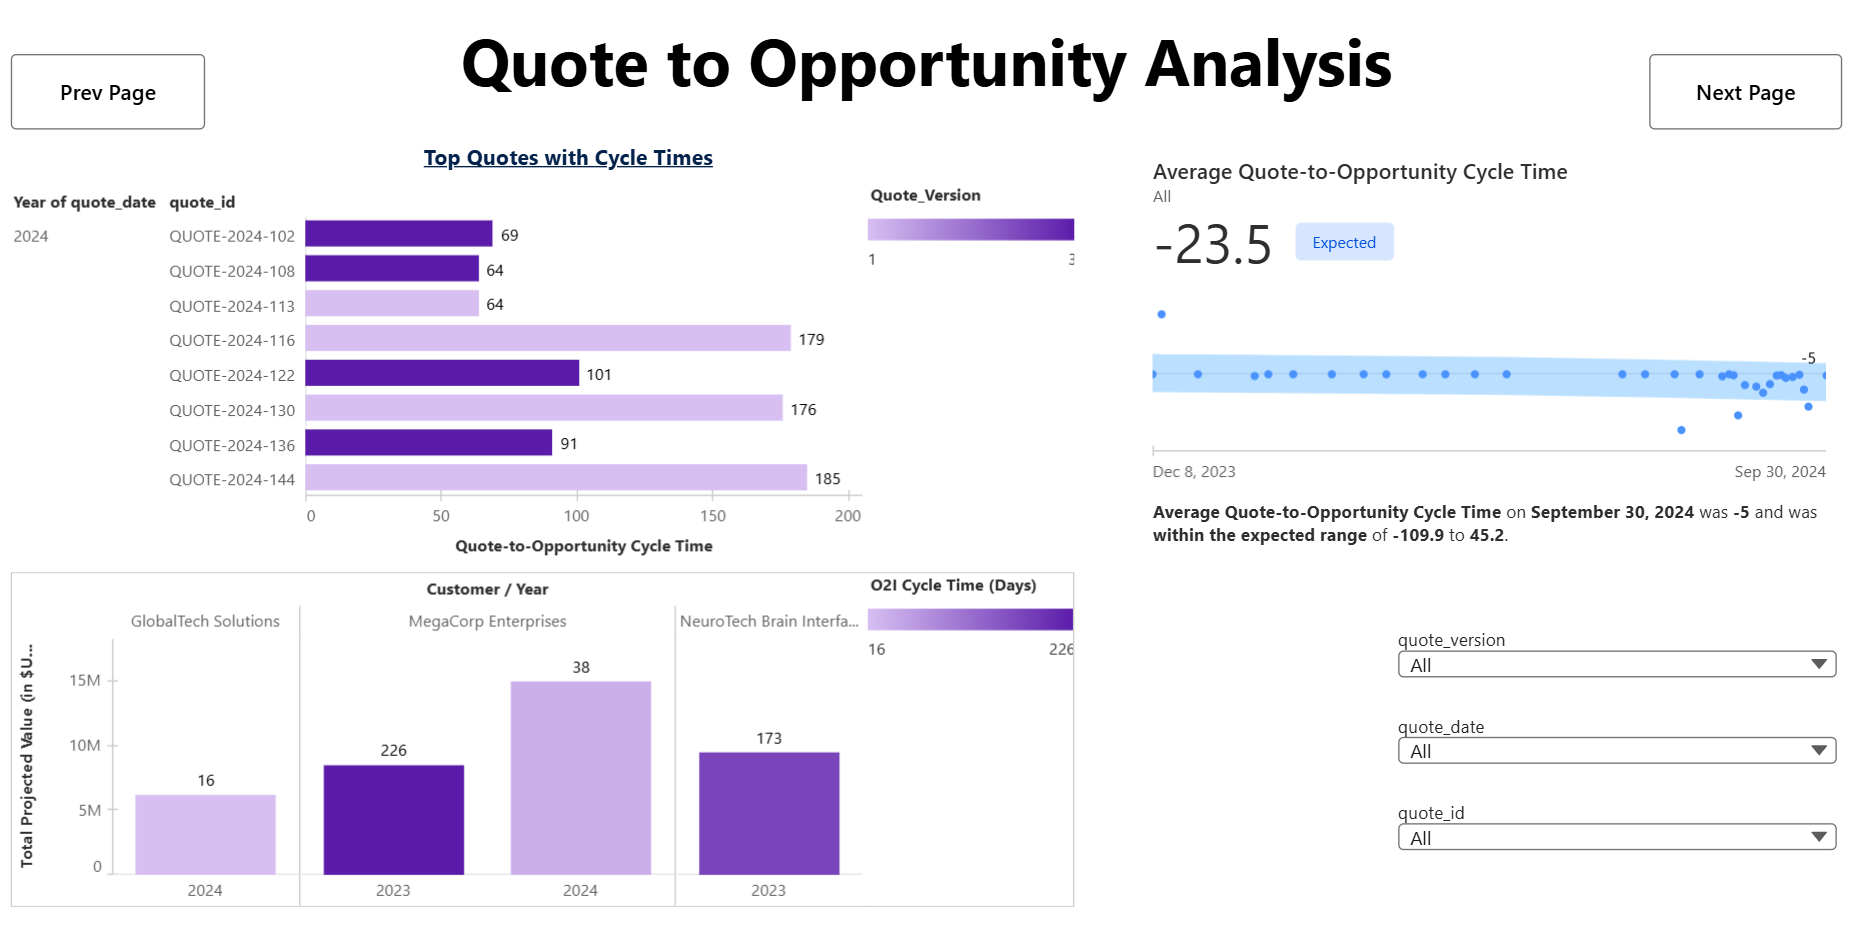
Semantic Model in Tableau Next Visualizations: We kept the dashboard simple - only main charts covering throughput, efficiency, risk, and accuracy.
Triggers: Finally, we added two automated Slack alerts:
If Realized Value Per Opportunity drifts outside its expected band.
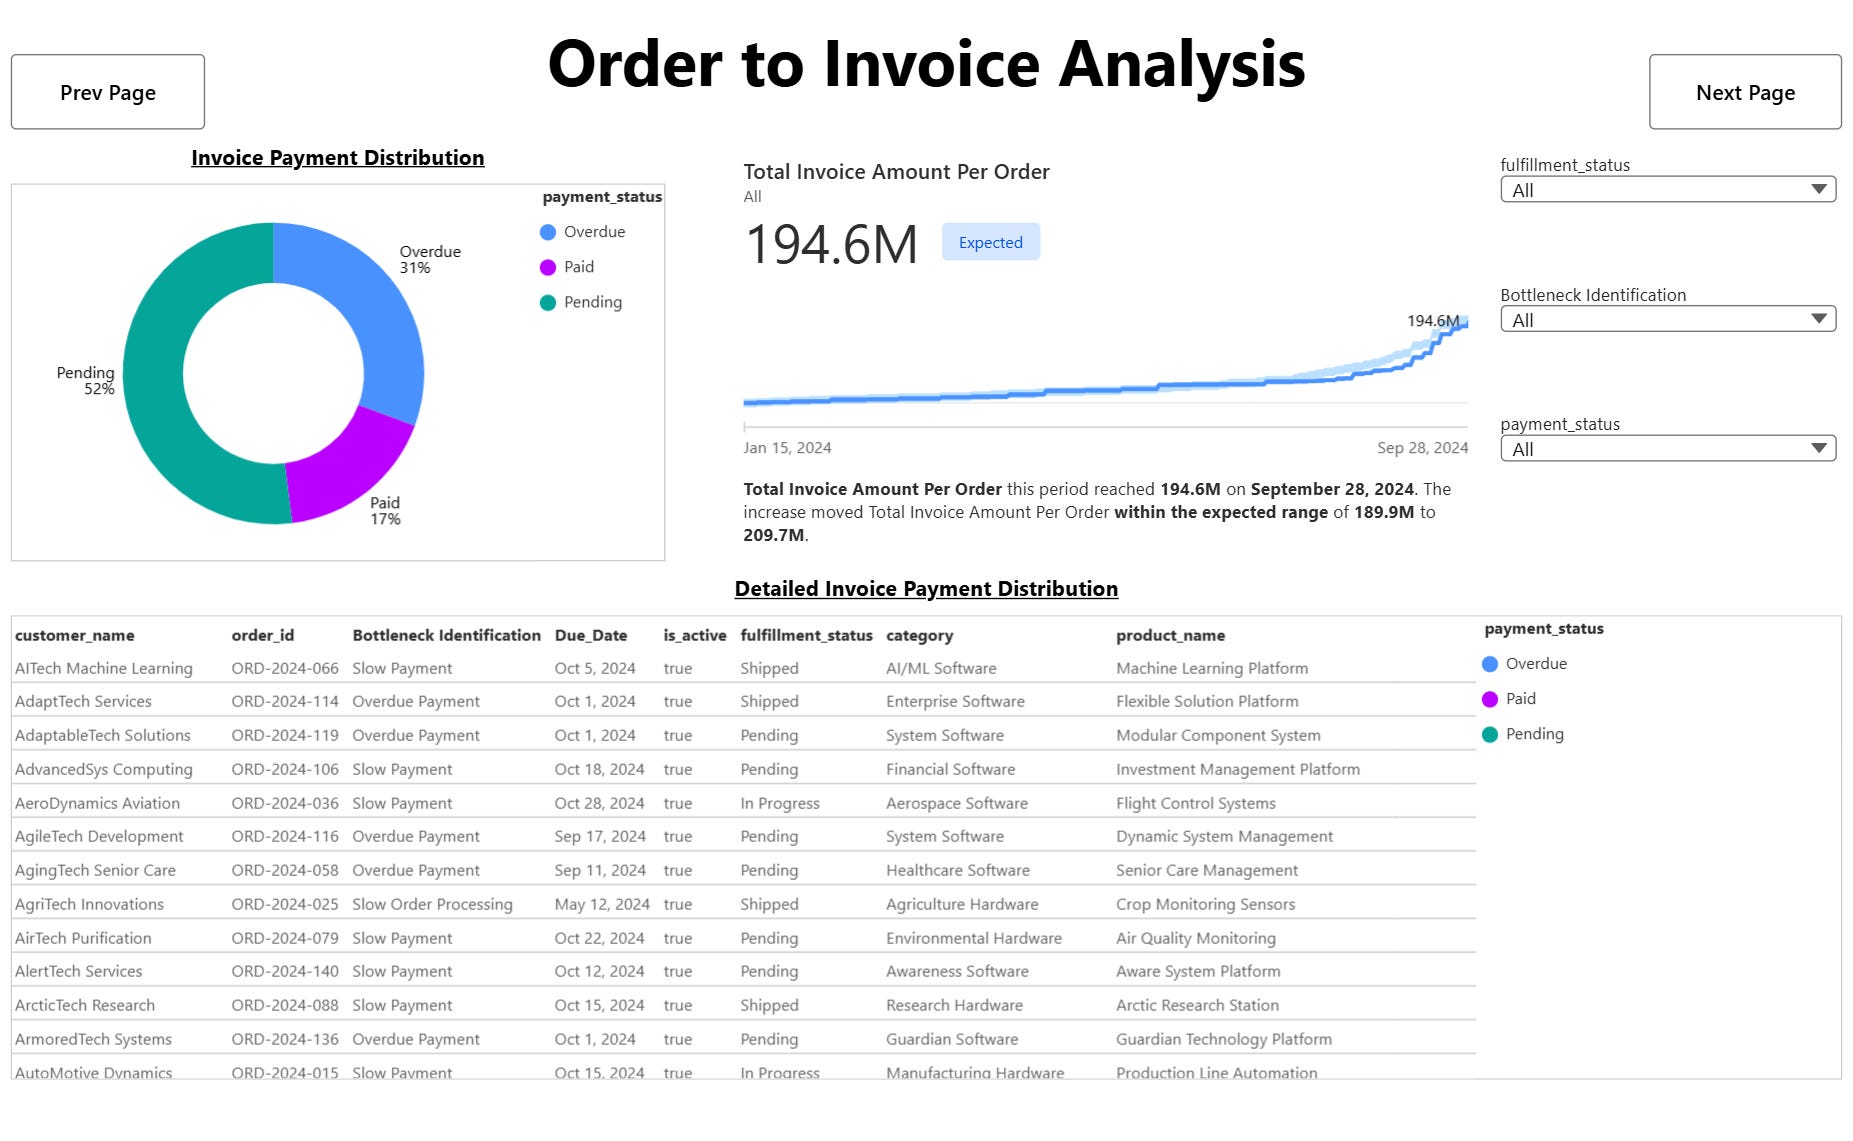
If Overdue Invoices > 30%.
Here’s a look at our final dashboard with detailed analysis for a few stages -
Methodology
Data Modeling: Built ER diagrams for QTC flow, defined relationships, and created stage-specific SLA flags.
Semantic Layer: Added calculated fields like Quote-to-Opportunity Cycle Time, Opportunity-to-Order Conversion Rate, and Invoice Amount Per Order.
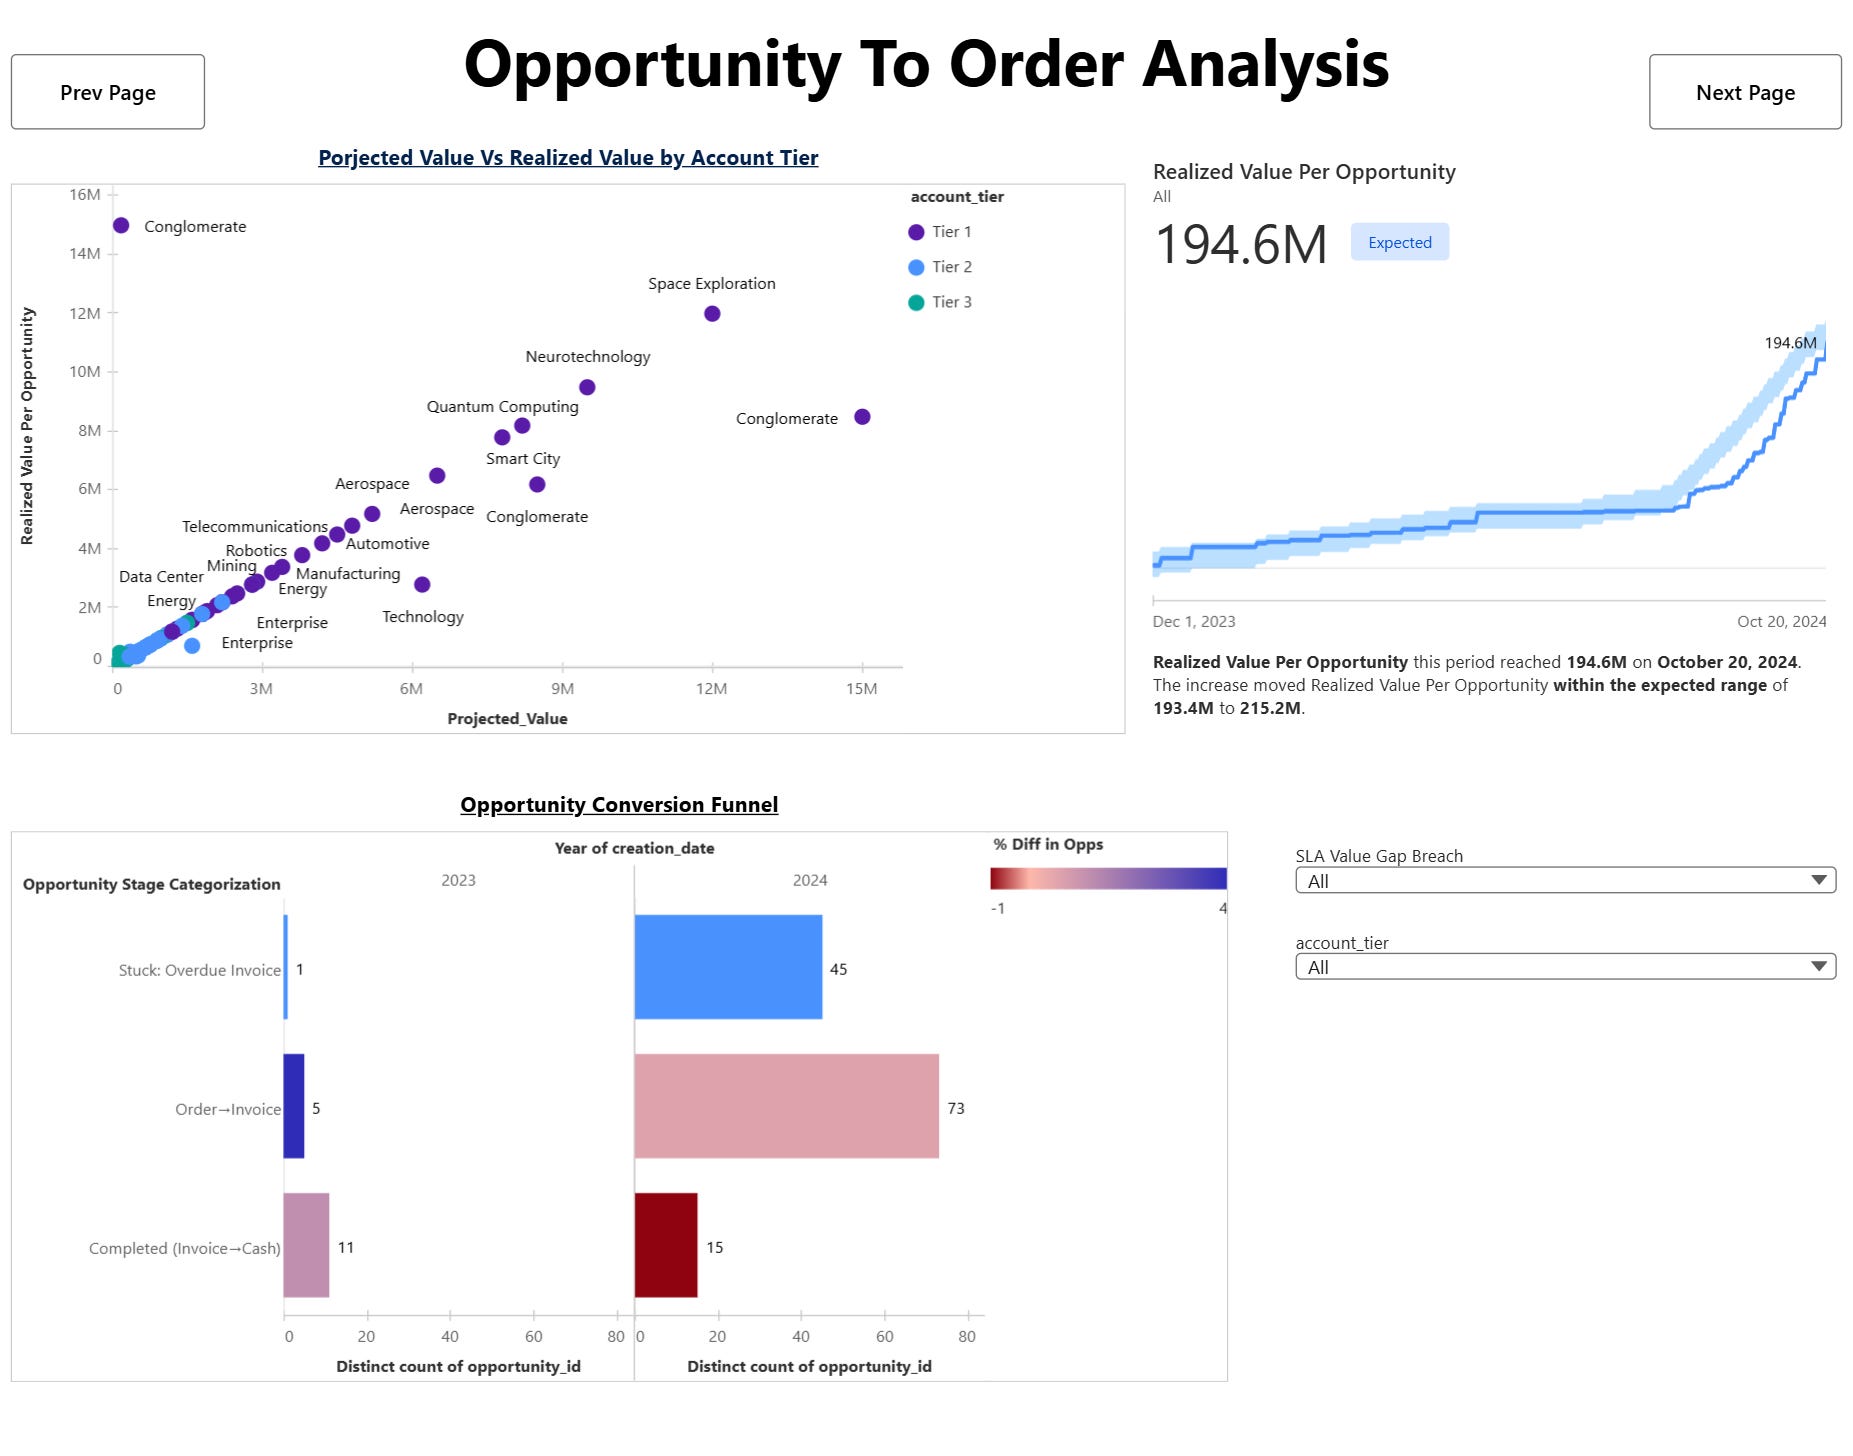
Visualization: Kept it simple with 3–4 core charts — funnel, bar vs SLA, donut for invoices, and bullet/scatter for projected vs realized values.
Automation: Connected triggers to Slack to close the loop between insight and action.
How is this helpful?
Early Detection of Risks: Real-time alerts on overdue invoices prevent cash flow surprises.
Governed Metrics: With semantic KPIs, Finance and Sales no longer debate over numbers.
Operational Efficiency: Tracking cycle times against SLAs highlights bottlenecks. For example, whether quotes take too long to become opportunities or orders stall before invoicing.
Revenue Accuracy: Comparing projected vs. realized values ensures forecasts align with actuals, helping leadership make better strategic decisions.
Action, Not Just Analysis: By sending alerts into Slack, the system prompts immediate follow-up instead of waiting for someone to refresh a dashboard.
What Worked Well
One of the biggest accelerators for us was the Einstein AI inside Tableau Next.
Instead of manually writing every calculated field, we could simply describe the metric in natural language - for example, “average difference in days between invoice date and due date” - and Einstein automatically generated the correct formula based on our data objects. This saved us hours of formula debugging.
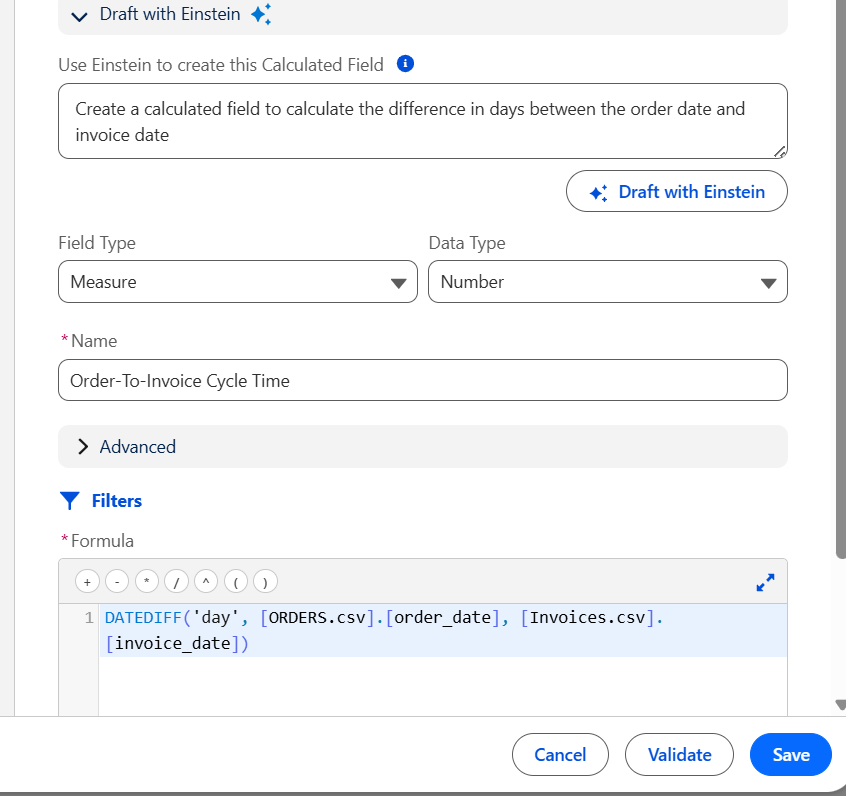
Einstein AI in action Einstein also helped us when building the Semantic Layer by suggesting relationships between objects. It recognized connections like Quotes → Opportunities → Orders → Invoices with surprising accuracy, reducing the time we would have otherwise spent checking and validating joins.

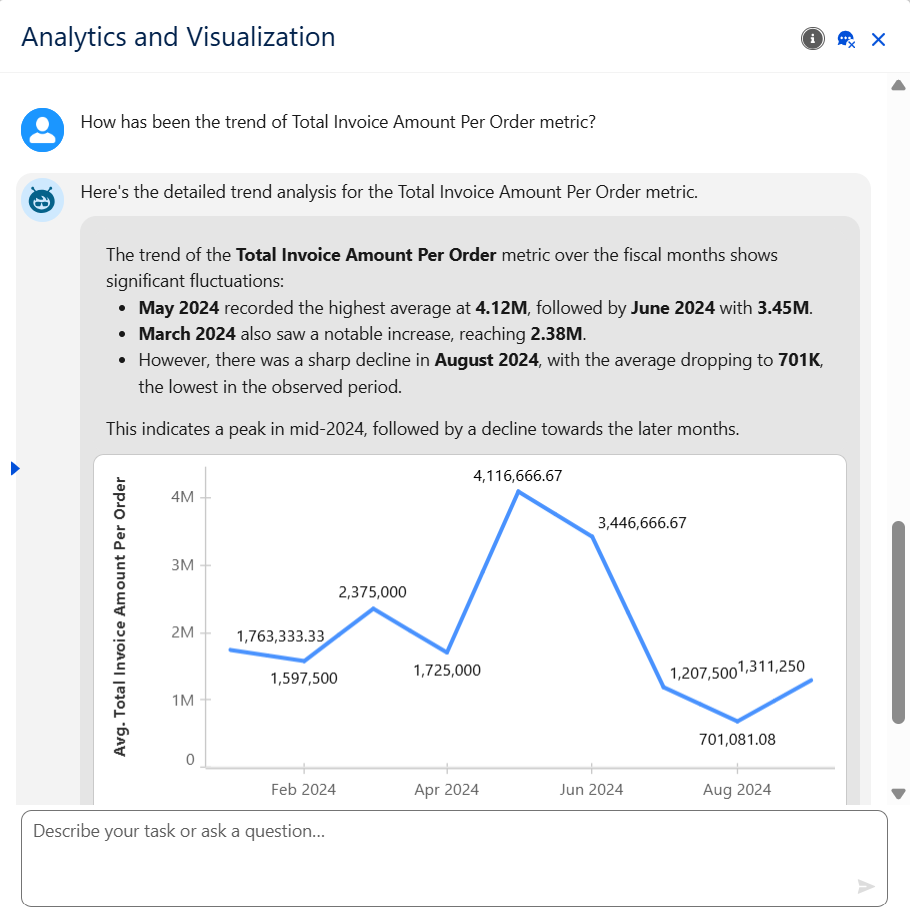
On top of this, Agentforce’s insights on metrics were next level. It didn’t just surface data - it contextualized metrics, flagged anomalies, and explained trends in plain language. This meant we weren’t just building dashboards; we were building an intelligent assistant that proactively guided us toward the right KPIs to watch.
Together, these features sped up our build process and let us focus more on the business problem rather than syntax or plumbing. In a hackathon setting where time is tight, this was a real game-changer.
Challenges
Of course, no project is without challenges. For us, the learning curve of Tableau Next was moderate - the Semantic and Visualization layers were exciting but required careful setup, often requiring us to start over multiple times.
We also noticed that the Visualization Layer misses many features from traditional Tableau, which limited the polish of our charts. With more time, we could have experimented with workarounds and delivered even more powerful insights.
Still, these constraints helped us stay focused on the essentials: building metrics that actually trigger business actions.
Conclusion
This hackathon showed me the real promise of Tableau Next: analytics that acts. Instead of being a static reporting tool, it becomes an intelligent partner embedded directly in workflows.
Our Quote-to-Cash prototype demonstrated that with the right semantic model, clear SLAs, and simple but powerful dashboards, businesses can not only understand what’s happening but also respond the moment things go wrong.
The hackathon ended, but the lesson stuck: the future of analytics is not dashboards - it’s trigger-driven, AI-supported, workflow-integrated decision-making.
Thanks for reading this till the end. I’m Tanay - I love building data products.